GTX has the capability of simultaneously viewing:
- Live and stored data. Data previously assimilated and stored can be compared to real time data in the same display whether it is in a graph or added to a report in text or spreadsheet format
- Data with different sample rates and frequency spacing.
- Multiple data files from different test runs.
- Computes data (with optional calculator)
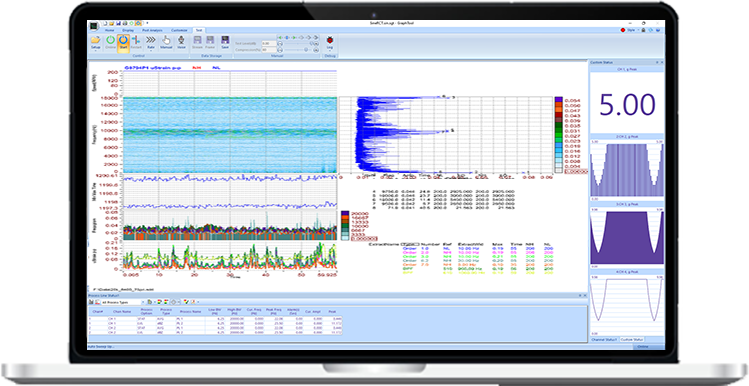
Report generation is as simple as clicking a mouse button. Time and frequency data of different sample rates and bandwidths can be overlaid and compared on the same graph. Individually annotated random and swept sine data may be simultaneously displayed in the same graph.